Wat Is Het Verschil Tussen Equity en Saldo?
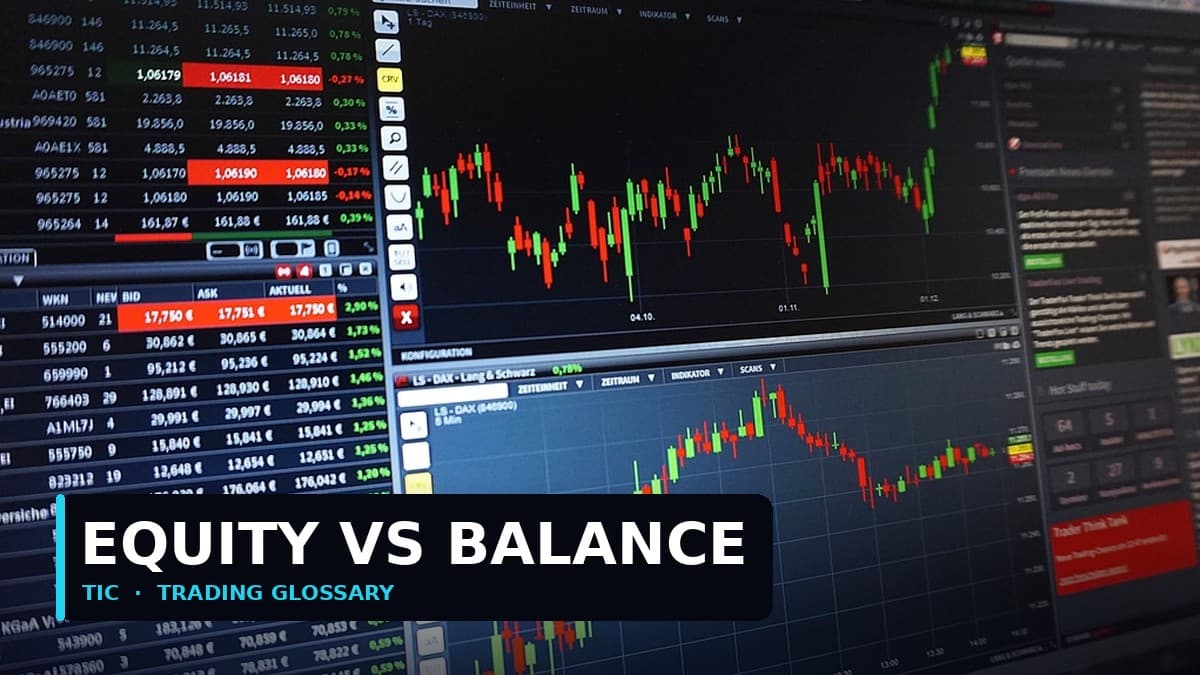
Saldo is het contante geld op uw tradingrekening van alleen gesloten transacties. Equity is wat de rekening op dit moment daadwerkelijk waard is, wat uw saldo is plus of min de winst en het verlies van elke nog open positie.
Wanneer u geen open posities heeft, zijn de twee cijfers identiek. Zodra u een transactie opent, lopen ze uiteen, en het verschil ertussen is het belangrijkste cijfer op uw platform.
Waarom Beweegt Equity Terwijl Saldo Stilstaat?
Omdat saldo alleen wordt bijgewerkt wanneer een transactie sluit, terwijl equity bij elke tick wordt bijgewerkt. Uw saldo is geschiedenis. Uw equity is het heden.
De formule die uw platform gebruikt, is simpelweg:
Zwevende winst en verlies is het niet-gerealiseerde resultaat van open posities. Als u $300 achterstaat op een open goudtransactie, heeft die $300 uw equity al verlaten, ook al is uw saldo geen cent veranderd. Handelaren die naar het saldocijfer kijken, voelen zich prima totdat de positie voor hen wordt gesloten.
Hier is dezelfde rekening op vier momenten op één dag:
| Moment | Saldo | Zwevende W/V | Equity |
|---|---|---|---|
| Voor het openen van een transactie | $10.000 | $0 | $10.000 |
| Na het openen van 0,20 lots goud | $10.000 | -$8 (spread) | $9.992 |
| Goud beweegt $22 tegen de positie | $10.000 | -$448 | $9.552 |
| Transactie gesloten met dat verlies | $9.552 | $0 | $9.552 |
Merk op dat het saldo helemaal niet bewoog tot de laatste rij, terwijl de rekening uren daarvoor werkelijk $448 minder waard was. Niets in rij drie was hypothetisch. Dat was echt geld, al verdwenen, alleen nog niet geregistreerd.
Hoe Passen Equity, Margin en Vrije Margin Samen?
Equity is de teller van de berekening die bepaalt of uw broker uw posities sluit. De keten loopt: equity gedeeld door gebruikte margin geeft het marginniveau, uitgedrukt als percentage, en wanneer dat percentage ver genoeg daalt, grijpt de broker in.
De drie gerelateerde cijfers zijn:
- Gebruikte margin — het deposito dat vastzit om uw open posities aan te houden
- Vrije margin — equity min gebruikte margin, het bedrag beschikbaar voor nieuwe transacties of verdere verliezen
- Marginniveau — (equity ÷ gebruikte margin) × 100
Werk het uit. Op een saldo van $10.000 met 0,20 lots goud open bij 20:1 hefboomwerking, betekent goud op $2.400 een notionele waarde van 20 ounces × $2.400 = $48.000, dus de gebruikte margin is $2.400.
| Goud beweegt | Zwevende W/V | Equity | Vrije margin | Marginniveau |
|---|---|---|---|---|
| $0 | $0 | $10.000 | $7.600 | 417% |
| -$100 | -$2.000 | $8.000 | $5.600 | 333% |
| -$300 | -$6.000 | $4.000 | $1.600 | 167% |
| -$400 | -$8.000 | $2.000 | -$400 | 83% |
Bij de onderste rij bevindt de rekening zich bij de meeste brokers in stop-out-gebied, waarvan de drempels doorgaans tussen 20% en 100% marginniveau liggen. Het saldo blijft de hele weg naar beneden $10.000 tonen. Dit is precies het mechanisme dat wordt beschreven in wat een margin call werkelijk is, en de hefboomwerking die het versterkt, wordt behandeld in hoe hefboomwerking werkelijk werkt.
Op Welk Cijfer Moet U Uw Risico Beheren?
Equity, altijd. Een positie dimensioneren op basis van uw saldo terwijl u open verliezen draagt, is hoe handelaren stilletjes hun echte blootstelling verdubbelen zonder het te merken.
Stel dat uw regel is 1% per transactie te riskeren. Met een saldo van $10.000 en twee open posities die zweven op -$1.500, is uw equity $8.500. Een risico van 1% is $85, niet $100. Het saldocijfer gebruiken betekent dat u 1,18% riskeert van het geld dat u daadwerkelijk heeft, en die fout stapelt zich precies op wanneer het het meest pijn doet, omdat open verliezen het grootst zijn tijdens precies de periodes waarin u het meest geneigd bent in de verleiding te komen voor nog een transactie.
Er is een tweede reden. Drawdown, het cijfer dat elk serieus prestatietrackrecord rapporteert, wordt gemeten op equity, niet saldo. Een op saldo gebaseerde curve kan er perfect glad uitzien terwijl de rekening herhaaldelijk dicht bij een stop-out staat, omdat een positie die met een groot zwevend verlies wordt aangehouden simpelweg nooit verschijnt. Dit is een van de standaardmanieren waarop een zwak trackrecord rustig wordt gemaakt lijken, en daarom moet drawdown altijd worden gelezen als een equity-cijfer.
Een korte reeks regels die hier direct uit volgt:
Het is het enige cijfer dat weerspiegelt wat u momenteel bezit.
Vrije margin kan positief zijn terwijl het marginniveau al dun is.
Een groot zwevend verlies is geen transactie die nog niet verloren heeft. Het is een transactie die verloren heeft en nog niet geregistreerd is.
Overnight-financiering wordt elke nacht van equity afgetrokken op aangehouden posities, dus een trage transactie bloedt leeg zelfs als de prijs niet beweegt.
Wat Is de TIC-invalshoek op Equity versus Saldo?
De eerlijke invalshoek is dat de meeste failliete rekeningen niet ontploffen op één slechte transactie. Ze ontploffen omdat de handelaar dagenlang naar het saldo keek terwijl de equity een ander verhaal vertelde, en tegen de tijd dat de twee cijfers overeenkwamen, was er geen ruimte meer om te handelen.
Het is ook waarom prestaties beoordeeld moeten worden op een geverifieerde equitycurve in plaats van een screenshot van een saldo. Een equitycurve legt elke open positie bloot die slecht verliep voordat hij werd gesloten, wat precies de informatie is die een saldocijfer verbergt. TIC publiceert om die reden onafhankelijk geverifieerde Myfxbook-trackrecords, en u kunt de equitycurve inspecteren op /results.
Als u het volledige plaatje wilt, lees dit dan samen met hoe pips en lots zich vertalen naar geld, want de dimensioneringsrekenkunde is wat een equitycijfer verbindt met een echte positie.
handelen brengt een hoog risico met zich mee en u kunt uw kapitaal verliezen; resultaten uit het verleden bieden geen garantie voor de toekomst; uitsluitend educatief, geen beleggingsadvies.
Verify any trader's results in 10 minutes
Seven checks that reveal whether a track record is real: third-party verification, maximum drawdown, trade count, and the martingale warning signs. Use it on anyone — including on us.
We'll send the checklist plus occasional TIC insights. We never share your email, and you can unsubscribe any time.