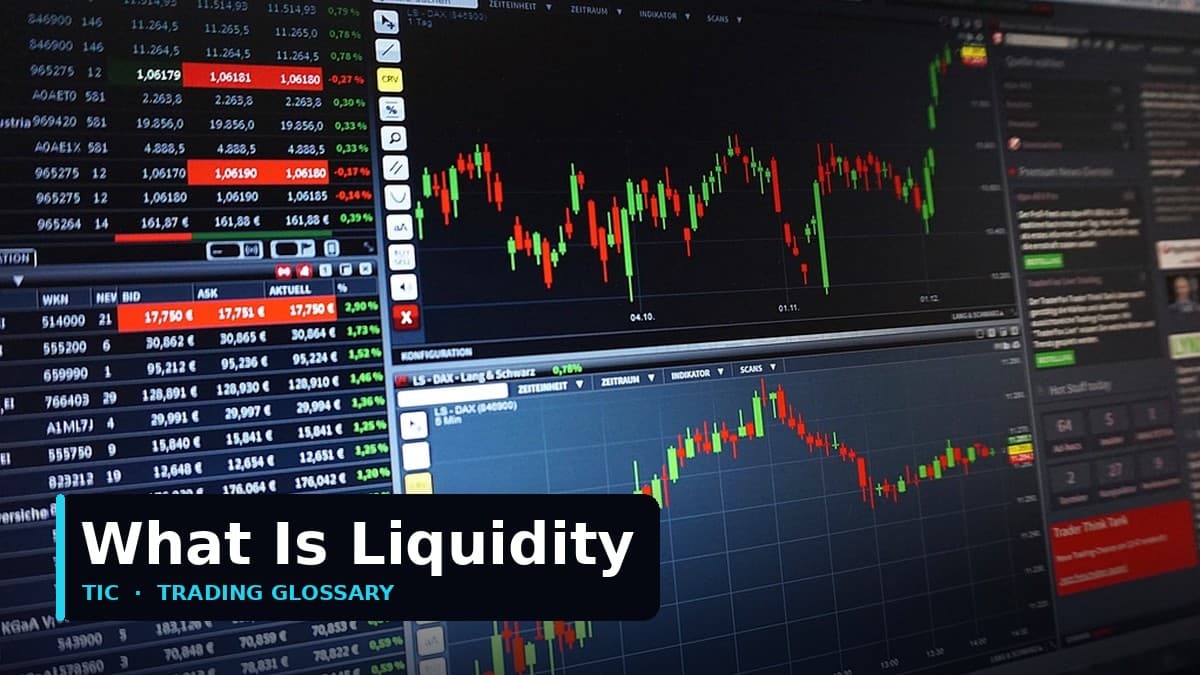
What is liquidity in trading?
Liquidity is the market's ability to absorb buy and sell orders without moving price too far. A liquid market lets you enter and exit near the quoted price because there are enough counterparties available at nearby levels.
That is the direct definition. In practice, liquidity is the reason the same order can feel easy in one hour and expensive in the next.
Why does liquidity matter so much?
Because liquidity controls three costs at once: the spread you pay, the slippage you suffer, and the ease with which you can exit when the market moves fast. When liquidity is deep, the market can take your size with less friction. When liquidity is thin, your order walks through the book and the price moves against you faster.
This is why two traders can click the same buy button on gold and get slightly different experiences. The trader entering during a busy London and New York overlap may see a tighter spread and cleaner fill. The trader entering during rollover or immediately after a shock headline may see a wider spread and worse execution.
How does liquidity change spread and slippage?
Directly. Dealers and matching engines show tighter prices when many buyers and sellers are active, and they widen those prices when counterparties are scarce or risk rises.
Here is a simple gold example using a 1.00 lot order:
| Market condition | Spread | Slippage on entry | Total friction cost |
|---|---|---|---|
| Deep liquidity | $0.20 | $0.10 | $30 |
| Average liquidity | $0.40 | $0.25 | $65 |
| Thin liquidity | $1.20 | $0.80 | $200 |
On gold, one standard lot is 100 ounces, so every $1.00 of movement is $100. In the thin-liquidity example above, the combined cost of spread and slippage is $2.00, which is $200 before the trade idea has even had a chance to work. That is why spread and slippage are really liquidity topics in disguise.
When is liquidity strong and when does it weaken?
Liquidity is usually strongest when major financial centres overlap and weakest when participation drops or uncertainty suddenly spikes. For gold and major FX pairs, London hours and the London and New York overlap tend to be the deepest part of the day. Liquidity often weakens around the daily rollover, before key sessions fully open, and during the first seconds of major macro releases.
It can also disappear unevenly. A market may look calm on your screen, but one side of the book can still be thin. That is how stop losses get filled worse than expected during a fast move even though price was stable two seconds earlier.
The pattern is similar across instruments:
| Environment | Typical liquidity quality | What traders usually notice |
|---|---|---|
| London open to New York overlap | Strong | Tighter spreads, cleaner fills |
| Quiet late-session hours | Moderate to weak | Wider spreads, slower exits |
| Major data release | Unstable | Fast repricing, higher slippage |
| Weekend reopen | Fragile | Gaps and poor stop execution |
How should you use liquidity in risk management?
Use liquidity to decide when your normal position size is too large for the environment. If the market is thin, the same stop distance is effectively less reliable because the fill can be worse. That means your real risk is wider than the chart alone suggests.
Suppose your gold plan allows $150 of risk and your technical stop is $15. In perfect execution, a 0.10 lot position fits that budget because every $1.00 is worth $10 at 0.10 lots. But if thin conditions add $0.70 of slippage to the stop, your actual loss rises by another $7. On one trade that is manageable. Across repeated thin-session entries it becomes a pattern of oversizing.
The practical response is not panic. It is adjustment:
If spreads are materially wider than normal, reduce size or wait.
They are not. A setup taken in a deep session is not the same product as the same chart taken during a thin one.
Many traders think only about entry quality. Liquidity matters even more when you need to get out.
What is the TIC angle on liquidity?
The honest angle is that liquidity shows up in the final result whether you acknowledge it or not. Independently verified Myfxbook performance includes the real fill conditions the account lived through, which is exactly why verified execution matters more than backtest elegance. You can inspect that standard at /results.
If you want to build the full picture, pair liquidity with what stop loss really does and how pips and lots translate into money. Good traders do not just ask whether the setup is valid. They ask whether the market is liquid enough for their size.
trading carries high risk and you may lose your capital; past performance does not guarantee future results; educational only, not investment advice.
Verify any trader's results in 10 minutes
Seven checks that reveal whether a track record is real: third-party verification, maximum drawdown, trade count, and the martingale warning signs. Use it on anyone — including on us.
We'll send the checklist plus occasional TIC insights. We never share your email, and you can unsubscribe any time.