نمونے کا سائز طے کرتا ہے کہ آیا ایک ٹریک ریکارڈ ثبوت ہے یا سجاوٹ، اور ریاضی بے رحم ہے: یورپی ریٹیل سرمایہ کاروں کو مارکیٹ کیے گئے زیادہ تر ریکارڈز کسی بھی نتیجے کی حمایت کرنے کے لیے بہت مختصر ہیں۔
یہ مضمون اس بارے میں ہے کہ وہ ریاضی خود کیسے کی جائے۔ یہ کسی ایسے شخص کے ساتھ آپ کو مقبول نہیں بنائے گا جو کوئی حکمت عملی بیچ رہا ہو، کیونکہ ایماندارانہ جواب یہ ہے کہ بہت سے شائع شدہ ریکارڈز، بشمول کچھ جن میں حقیقتاً حقیقی ٹریڈز ہوں، کچھ ثابت نہیں کرتے۔
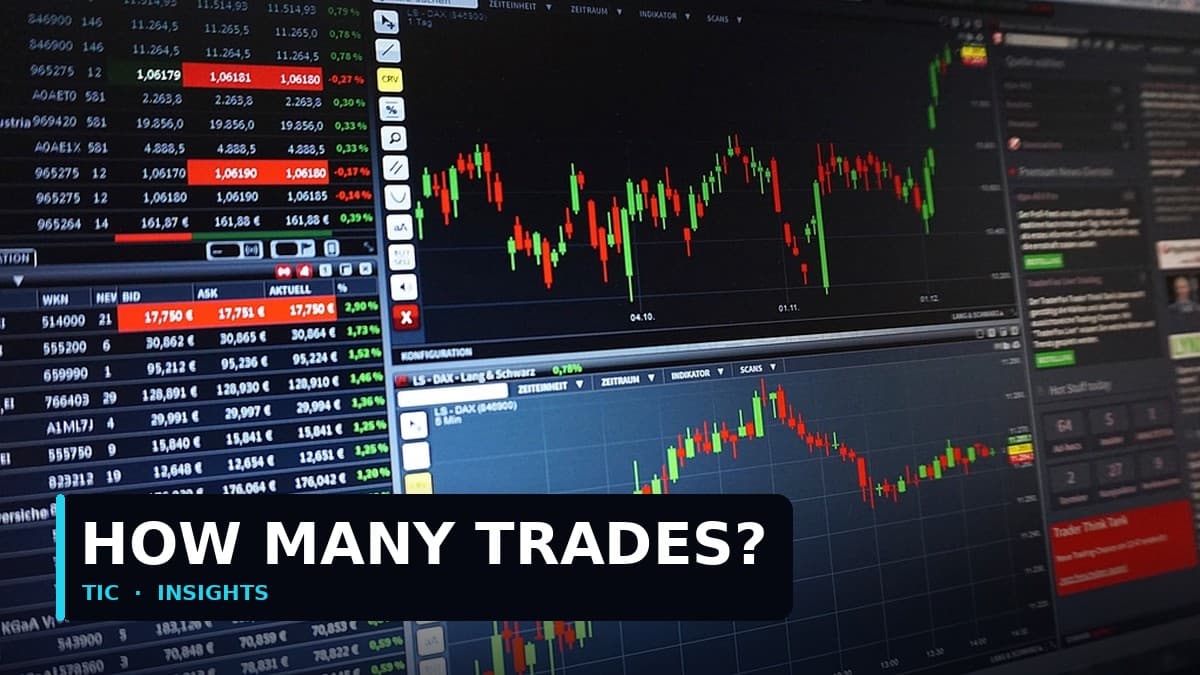
آپ کو ایک ٹریڈنگ حکمت عملی جانچنے کے لیے کتنے ٹریڈز درکار ہیں؟
جیت کی شرح پر ایک اندازاً قرأت کے لیے، چند سو۔ اس اعتماد کے لیے کہ ایک برتری حقیقی ہے، قسمت نہیں، تقریباً ایک ہزار، اور تب بھی صرف اگر وہ ٹریڈز ایک سے زیادہ مارکیٹ نظام میں پھیلے ہوں۔ تقریباً سو ٹریڈز سے کم کو ایک قصے کے طور پر لیا جانا چاہیے، نتیجے کے طور پر نہیں۔
وجہ ایک فارمولا ہے جسے آپ ایک spreadsheet میں چلا سکتے ہیں۔ ایک مشاہدہ شدہ جیت کی شرح کے گرد غیر یقینی تقریباً p گنا (1 مائنس p) کا اسکوائر روٹ ہے، ٹریڈز کی تعداد سے تقسیم، جہاں p مشاہدہ شدہ جیت کی شرح ہے۔ اسے 1.96 سے ضرب دیں اور آپ کے پاس 95% اعتماد کا وقفہ ہے: وہ رینج جس میں اصل جیت کی شرح معقول طور پر بیٹھتی ہے۔
اسے ایک 55% جیت کی شرح دکھانے والے ریکارڈ پر چلائیں اور نتیجہ ہوش اڑا دینے والا ہے۔
| ٹریڈز | مشاہدہ شدہ جیت کی شرح | اصل جیت کی شرح، 95% رینج | آپ ایمانداری سے کیا نتیجہ نکال سکتے ہیں |
|---|---|---|---|
| 20 | 55% | 33% سے 77% | کچھ نہیں۔ ایک سکہ اس رینج کے اندر ہے۔ |
| 50 | 55% | 41% سے 69% | پھر بھی کچھ نہیں۔ ایک سکہ اس رینج کے اندر ہے۔ |
| 100 | 55% | 45% سے 65% | ایک سکہ اب بھی خارج نہیں ہے۔ |
| 250 | 55% | 49% سے 61% | شاید ایک سکے سے بہتر۔ شاید۔ |
| 500 | 55% | 51% سے 59% | ایک حقیقی برتری، اگر کچھ اور نہ بدلا ہو۔ |
| 1,000 | 55% | 52% سے 58% | اب عدد کچھ معنی رکھتا ہے۔ |
پہلی دو قطاریں دوبارہ پڑھیں۔ 55% جیت دکھانے والا ایک 50-ٹریڈ ریکارڈ اعداد و شمار کے لحاظ سے ایک سکے کے اچھلنے سے الگ نہیں کیا جا سکتا۔ یہ Trader پر تنقید نہیں ہے۔ یہ ایک بیان ہے کہ پچاس مشاہدات کیا ثابت کر سکتے ہیں، اور یہ آپ کے اپنے نتائج پر بھی بالکل ویسے ہی لاگو ہوتا ہے۔
ایک 55% جیت کی شرح اصل میں آپ کو کیا بتاتی ہے؟
خود اپنے طور پر، تقریباً کچھ نہیں، یہاں تک کہ ایک ہزار ٹریڈز کے ساتھ بھی۔ اوسط جیت اور اوسط نقصان کے بغیر جیت کی شرح ایک بے معنی عدد ہے، کیونکہ ایک حکمت عملی جو 80% وقت جیتتی ہے وہ مسلسل رقم کھو سکتی ہے اور ایک جو 35% وقت جیتتی ہے وہ خوبصورتی سے compound کر سکتی ہے۔
دو ریکارڈز پر غور کریں، دونوں 500 ٹریڈز کے ساتھ۔
حکمت عملی A 72% وقت جیتتی ہے۔ اوسط جیت 40 یورو، اوسط نقصان 130 یورو۔ فی ٹریڈ توقع 0.72 گنا 40، مائنس 0.28 گنا 130، جو 28.8 مائنس 36.4 ہے، ہر ٹریڈ میں 7.60 یورو کا نقصان۔ 500 ٹریڈز پر یہ 3,800 یورو کا نقصان ہے، ایک ایسی جیت کی شرح کے ساتھ جو مارکیٹنگ صفحے پر شاندار لگتی ہے۔
حکمت عملی B 38% وقت جیتتی ہے۔ اوسط جیت 210 یورو، اوسط نقصان 90 یورو۔ توقع 0.38 گنا 210، مائنس 0.62 گنا 90، جو 79.8 مائنس 55.8 ہے، فی ٹریڈ 24 یورو کا فائدہ۔ 500 ٹریڈز پر، 12,000 یورو، ایک ایسے ریکارڈ سے جو شہ سرخی میں معمولی لگتا ہے۔
حکمت عملی A وہ شکل ہے جو جیتنے والوں کو جلدی کاٹنے اور نقصان اٹھانے والوں کو چلنے دینے سے پیدا ہوتی ہے، اور یہ ریٹیل ٹریڈنگ میں سب سے عام نقصان دہ پیٹرن ہے۔ یہ مارکیٹ کرنا بھی سب سے آسان ہے، کیونکہ جیت کی شرح وہ عدد ہے جسے لوگ اسکرین شاٹ لیتے ہیں۔ ہمیشہ اوسط جیت، اوسط نقصان اور ٹریڈز کی تعداد ایک ساتھ مانگیں، یا R میں توقع مانگیں، جو تینوں کو ایک عدد میں سمیٹتی ہے۔ رسک اور reward اس تناسب کو صحیح طریقے سے بیان کرتا ہے۔
وقت ٹریڈ کی تعداد سے زیادہ اہمیت کیوں رکھتا ہے؟
کیونکہ مارکیٹس بدلتی ہیں، اور ایک حکمت عملی کی برتری ایسے حالات کے بارے میں ایک دعویٰ ہے جو اب موجود نہ ہوں۔ ایک ہزار ٹریڈز جو اٹھارہ مہینوں کے ایک ٹرینڈنگ، کم-شرح، کم-اتار چڑھاؤ والے ماحول کے اندر لیے گئے ہوں وہ آپ کو بتاتے ہیں کہ حکمت عملی اس ماحول میں کیسا برتاؤ کرتی ہے اور کسی دوسرے کے بارے میں کچھ نہیں۔
یہی وجہ ہے کہ ایک high-frequency ریکارڈ چھ مہینوں میں ایک ہزار ٹریڈز تک پہنچ سکتا ہے اور پھر بھی کمزور ثبوت ہو سکتا ہے، جبکہ پانچ سالوں میں 300 ٹریڈز کے ساتھ ایک swing حکمت عملی چھوٹے نمونے کے باوجود مضبوط ثبوت ہو سکتی ہے۔ آپ چاہتے ہیں کہ نمونہ نظام کی تبدیلیوں کا احاطہ کرے: ایک شرح-بڑھانے کا سائیکل اور ایک کٹوتی کا سائیکل، ایک اتار چڑھاؤ کا اضافہ اور ایک سست گرمی، کم از کم ایک حقیقی بحران کا مہینہ۔
تاریخوں کے ساتھ ٹریڈ-بہ-ٹریڈ ہسٹری مانگیں، اور دیکھیں کہ ریکارڈ کن حالات سے گزرا نہ کہ صرف اس کا کل کیا تھا۔ 2023 میں شروع ہونے والا ایک ریکارڈ نے ایک حقیقی liquidity جھٹکا نہیں دیکھا۔ ایک ریکارڈ جو کسی بحران کے آس پاس کے مہینوں کو چھوڑ دیتا ہے شاید curate کیا گیا ہے۔
ایک صاف backtest اور مارکیٹ میں اصل میں جو fill ہوا اس کے درمیان خلا اپنا ہی ایک مسئلہ ہے، اور backtest بمقابلہ live نتائج اس بارے میں شامل ہے کہ وہ اعداد عام طور پر کہاں الگ ہوتے ہیں۔
کیا ایک نقصان دہ حکمت عملی ایک سال کے لیے اچھی لگ سکتی ہے؟
جی ہاں، آسانی سے، اور یہی ریاضی کا وہ حصہ ہے جسے نظر انداز کیا جاتا ہے کیونکہ یہ ناخوشگوار ہے۔ اگر ایک ہزار لوگوں میں سے ہر ایک کوئی برتری نہ رکھنے والی حکمت عملی چلاتا ہے، تو محض اتفاق ان میں سے تقریباً 25 کو ایک ایسا سال دے گا جو شاندار لگے، اور ایک مٹھی بھر شاندار لگیں گے۔
یہی وہ ریکارڈز ہیں جو مارکیٹ کیے جاتے ہیں، کیونکہ باقی 975 خاموشی سے شائع کرنا بند کر دیتے ہیں۔ آپ حکمت عملیوں کا ایک نمونہ نہیں دیکھ رہے۔ آپ ایک انتخابی عمل کے زندہ بچ جانے والوں کو دیکھ رہے ہیں، یہی وجہ ہے کہ سب سے اوپر کی کارکردگی والے اکاؤنٹس کی ایک leaderboard مالیات میں سب سے کم معلوماتی دستاویزات میں سے ایک ہے۔ ایک copy-trading leaderboard کے سب سے اوپر جیتنے والوں کو جیتنے کی بنیاد پر چنا گیا ہے، اور یہ سچ ہے چاہے آبادی میں کہیں بھی کوئی برتری موجود ہو یا نہ ہو۔
عملی دفاع ان چیزوں کا مطالبہ کرنا ہے جنہیں survivorship جعلی نہیں بنا سکتی۔ اس فراہم کنندہ نے اس مدت کے دوران کتنے اکاؤنٹس یا حکمت عملیاں چلائیں، اور ان کے ریکارڈز کہاں ہیں جو بند کر دی گئیں؟ اس مخصوص اکاؤنٹ کی مکمل ہسٹری کیا ہے، اس کے پہلے ٹریڈ سے، نہ کہ کسی چنی ہوئی شروعاتی تاریخ سے؟ کیا ریکارڈ ایک تیسرے فریق کے ذریعے تصدیق شدہ ہے جسے فراہم کنندہ ترمیم نہیں کر سکتا؟
آخری سوال یہ ہے کہ تصدیق اعداد سے زیادہ کیوں اہمیت رکھتی ہے، اور یہ وہ معیار ہے جس پر TIC خود کو رکھتا ہے: /results پر Myfxbook ریکارڈ مکمل طور پر شائع کیا جاتا ہے، بشمول برے مہینوں کے، کیونکہ ایک ایسا ریکارڈ جسے شائع کنندہ خاموشی سے تراش سکتا ہے وہ ریکارڈ نہیں ہے۔ ان صفحات میں سے ایک کو اصل میں کیسے پڑھیں یہ Myfxbook ٹریک ریکارڈ پڑھنا میں شامل ہے۔
کیا نمونے کا سائز اس بات کو بدلتا ہے کہ آپ Drawdown کیسے پڑھتے ہیں؟
جی ہاں، اور اس سمت میں جس کی لوگ کم سے کم توقع کرتے ہیں۔ ایک ٹریک ریکارڈ میں زیادہ سے زیادہ Drawdown حکمت عملی کی کوئی خاصیت نہیں ہے۔ یہ مشاہدے کی کھڑکی میں پیش آنے والی بدترین چیز ہے، اور جتنی دیر آپ دیکھتے ہیں، وہ عدد اتنا ہی برا ہوتا جاتا ہے۔
چھ مہینوں کے لیے مشاہدہ کی گئی ایک حکمت عملی 9% زیادہ سے زیادہ Drawdown دکھا سکتی ہے۔ وہی حکمت عملی، بغیر بدلے، پانچ سالوں کے لیے مشاہدہ کی گئی بہت ممکن ہے کہ کہیں زیادہ برا کچھ دکھائے، کیونکہ ایک برے دور کے پیش آنے کے لیے زیادہ وقت تھا۔ مختصر-کھڑکی کے عدد کو ایک چھت سمجھنا وہ طریقہ ہے جس سے سرمایہ کار اس Drawdown سے حیران ہو جاتے ہیں جو حکمت عملی ہمیشہ پیدا کرنے کی صلاحیت رکھتی تھی۔
ایک کارآمد عادت: کوئی بھی زیادہ سے زیادہ Drawdown جو ایک مختصر ریکارڈ دکھائے، فرض کریں کہ اصل صلاحیت بامعنی طور پر بڑی ہے، اور اپنے آپ سے پوچھیں کہ کیا آپ بدترین لمحے پر پوزیشن چھوڑے بغیر اس سے گزر سکتے ہیں۔ Drawdown کا اصل مطلب اور Drawdown، Sharpe اور ٹریک ریکارڈ پڑھنا اس بارے میں مزید بتاتے ہیں کہ وہ اعداد کیسے حساب اور غلط پڑھے جاتے ہیں۔
وہی منطق Sharpe ratios پر لاگو ہوتی ہے۔ بارہ ماہانہ منافعوں سے حساب کیا گیا ایک Sharpe اس کے گرد ایک بہت بڑا اعتماد کا وقفہ رکھتا ہے، اتنا وسیع کہ ایک سال میں 1.8 کا Sharpe اور ایک سال میں 0.6 کا Sharpe قابل اعتماد طور پر مختلف حکمت عملیاں نہیں ہیں۔ Sharpe سالوں میں بامعنی ہوتا ہے، سہ ماہیوں میں نہیں۔
کسی بھی ریکارڈ پر بھروسہ کرنے سے پہلے کیا مانگیں
پانچ سوالات، ترتیب میں، اور ایک فراہم کنندہ جو انہیں جواب نہیں دے سکتا اس نے آپ کو کچھ بتا دیا ہے۔
مہینے نہیں، فیصد منافع نہیں۔ تعداد۔ 100 سے کم اور گفتگو ختم۔
تاریخیں، شروع سے اختتام تک، بغیر کسی خلا کے۔ پھر چیک کریں کہ مارکیٹ نے ان تاریخوں میں کیا کیا۔
اکیلی جیت کی شرح اوپر بیان کردہ وجوہات کی بنا پر کوئی جواب نہیں۔
خود شائع کردہ spreadsheets اور اسکرین شاٹس ثبوت نہیں ہیں۔ ایک read-only تیسرے فریق کا ریکارڈ ہے۔
Survivorship سب سے عام طریقہ ہے جس سے ایک ایماندار نظر آنے والا ریکارڈ ایک بھی جھوٹے عدد کے بغیر گمراہ کرتا ہے۔
اس میں سے کچھ بھی آپ کو نہیں بتاتا کہ ایک حکمت عملی کام کرے گی۔ اعداد و شمار صرف آپ کو یہ بتا سکتے ہیں کہ آیا ثبوت غور کرنے کے قابل ہونے کے لیے کافی مضبوط ہے، اور زیادہ تر مارکیٹ کیے گئے ریکارڈز کے لیے ایماندارانہ جواب یہ ہے کہ نہیں ہے۔ یہ جاننا کہ کون سے ریکارڈز کو رد کرنا ہے مہارت کا زیادہ تر حصہ ہے، اور یہی وہ فیصلہ ہے جو ایک ٹریڈنگ فراہم کنندہ پر بھروسہ کرنے سے پہلے due diligence میں شامل ہے۔
ٹریڈنگ میں زیادہ رسک شامل ہے اور آپ اپنا سرمایہ کھو سکتے ہیں؛ ماضی کی کارکردگی مستقبل کے نتائج کی ضمانت نہیں دیتی؛ صرف تعلیمی، سرمایہ کاری کا مشورہ نہیں۔
Verify any trader's results in 10 minutes
Seven checks that reveal whether a track record is real: third-party verification, maximum drawdown, trade count, and the martingale warning signs. Use it on anyone — including on us.
We'll send the checklist plus occasional TIC insights. We never share your email, and you can unsubscribe any time.