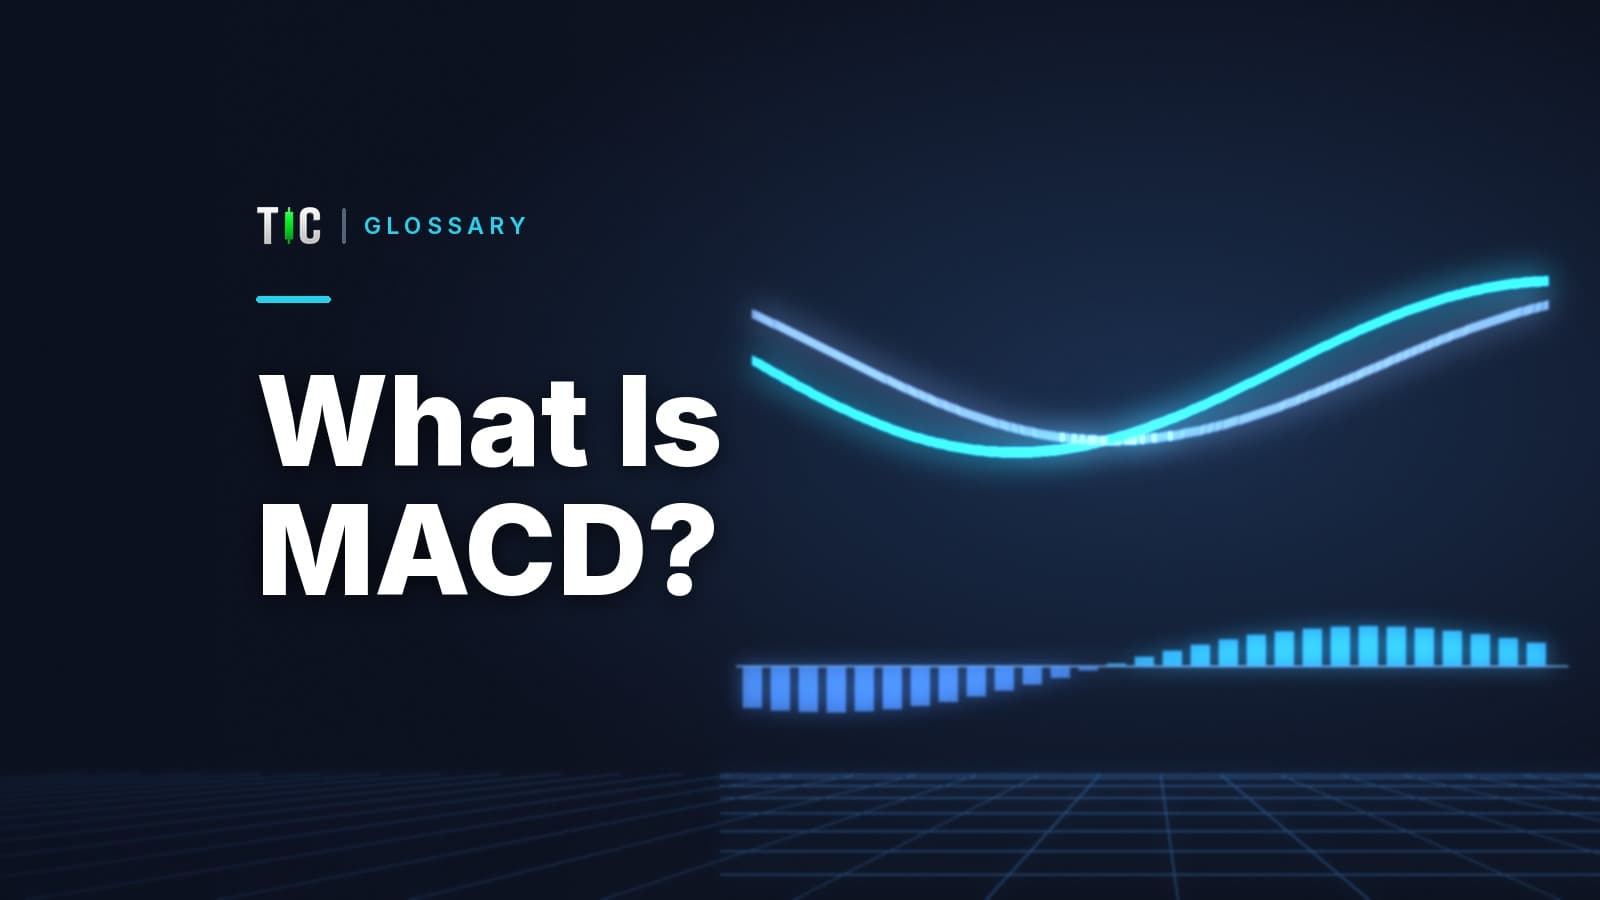
If you have asked "what is MACD and how do I read it", the short answer is: it tells you whether recent prices are pulling away from older prices, and whether that pull is getting stronger or weaker. It does not tell you where price will go next.
What is the MACD formula?
Three parts, all built from closing prices:
| Component | Formula with standard settings | What it shows |
|---|---|---|
| MACD line | EMA(12) minus EMA(26) | Distance between fast and slow trend |
| Signal line | 9 period average of the MACD line | A smoothed, slower version of MACD |
| Histogram | MACD line minus signal line | Whether momentum is accelerating or fading |
An EMA gives more weight to recent closes. Each new value is the previous EMA plus a fraction of the gap between the new close and the previous EMA. That fraction is 2 divided by (periods + 1): about 0.1538 for 12 periods, 0.0741 for 26 and 0.2 for 9. Our guide to moving averages covers simple versus exponential averages in more depth.
Most charting packages, and educational references such as Fidelity's indicator guide, use a 9 period EMA for the signal line. The MetaTrader 5 help documents its built-in MACD with a 9 period simple moving average for the signal line instead. The two give slightly different signal values and slightly different cross times. Neither is wrong, but if you compare readings between two platforms, check which one each uses.
How do you calculate MACD? A worked gold example
The figures below are hypothetical and chosen to show the arithmetic, not a market reading.
Yesterday's 12 period EMA on gold was 4,140.00. Today gold closes at 4,151.00. The new EMA is 4,140.00 + 0.1538 × (4,151.00 − 4,140.00) = 4,140.00 + 1.69 = 4,141.69.
Suppose that on one day the 12 period EMA is 4,142.0 and the 26 period EMA is 4,130.0. The MACD line is 4,142.0 − 4,130.0 = +12.0. The fast average is above the slow one, so short-term momentum is upward.
If the signal line stands at 9.5, the histogram is 12.0 − 9.5 = +2.5.
The 12 period EMA rises to 4,144.0 and the 26 period EMA to 4,131.5. MACD is now +12.5, higher than yesterday. The EMA signal line updates by 0.2 × (12.5 − 9.5) = 0.6, to 10.1. The histogram is 12.5 − 10.1 = +2.4, slightly smaller than yesterday's 2.5.
This is the most useful thing MACD shows. The MACD line rose, yet the histogram shrank, because momentum is still positive but no longer accelerating. If that continues, the histogram reaches zero exactly when the MACD and signal lines cross. A shrinking histogram is the early sign; the cross is the late confirmation.
How do traders read MACD?
The MetaTrader 5 documentation lists three common uses:
- Crossovers. MACD crossing above its signal line is read as bullish momentum, and crossing below as bearish. Crossing the zero line means the fast EMA has crossed the slow EMA.
- Overextension. A very large gap between the averages suggests price has run far from its recent average.
- Divergence. Price makes a new high but MACD does not, hinting that the move is losing force.
None of these are entry instructions. They are descriptions of momentum, best used alongside a level, a plan and a defined risk.
Why can MACD mislead you?
Everything in MACD is an average of past prices, and the slow component spans 26 periods. By the time a cross confirms, part of the move is already over.
Fidelity's guide notes that during trading ranges the MACD will whipsaw, with the fast line crossing back and forth across the signal line. In a sideways market, crossover rules generate repeated small losses plus costs.
On gold, a MACD of 12 means the averages are 12 dollars apart. On EUR/USD a comparable reading might be 0.0012. That means a fixed threshold such as "MACD above 5" cannot be copied from one market to another, or even from one gold price level to another. Compare MACD to its own recent history, not to a number from a blog.
Pick enough setting combinations and one will look brilliant on past data. Our article on backtest versus live results explains why that edge often disappears with real money.
MACD vs RSI: which one should you use?
They measure different things, and using both can make sense if you know what each adds.
| MACD | RSI | |
|---|---|---|
| Measures | Gap between two trend averages | Speed of recent gains versus losses |
| Scale | Unbounded, in price units | Fixed 0 to 100 |
| Strength | Trend momentum and its acceleration | Stretched conditions within a range |
| Weakness | Lags; whipsaws in ranges | Can stay extreme for long in strong trends |
Our RSI explainer covers the other half of this table.
How does this fit with TIC?
The free TIC Trading Academy in the TIC app includes a MACD lesson with a diagram of the two lines and the histogram, built around the same point made above: the histogram is the gap between the two lines, and it shrinks before they cross. Use it to practise reading momentum, then test any MACD rule on your own records before risking money on it. Whatever indicator you use, the stop loss and position size decide how much a wrong reading costs.
Sources
- MetaQuotes, MetaTrader 5 Help: Moving Average Convergence/Divergence
- Fidelity Learning Center, MACD technical indicator guide
Indicator settings and signal line methods differ between platforms. Check your platform's documentation before comparing values.
Trading carries high risk and you may lose your capital. Past performance does not guarantee future results. Educational only, not investment advice.
Verify any trader's results in 10 minutes
Seven checks that reveal whether a track record is real: third-party verification, maximum drawdown, trade count, and the martingale warning signs. Use it on anyone — including on us.
We'll send the checklist plus occasional TIC insights. We never share your email, and you can unsubscribe any time.