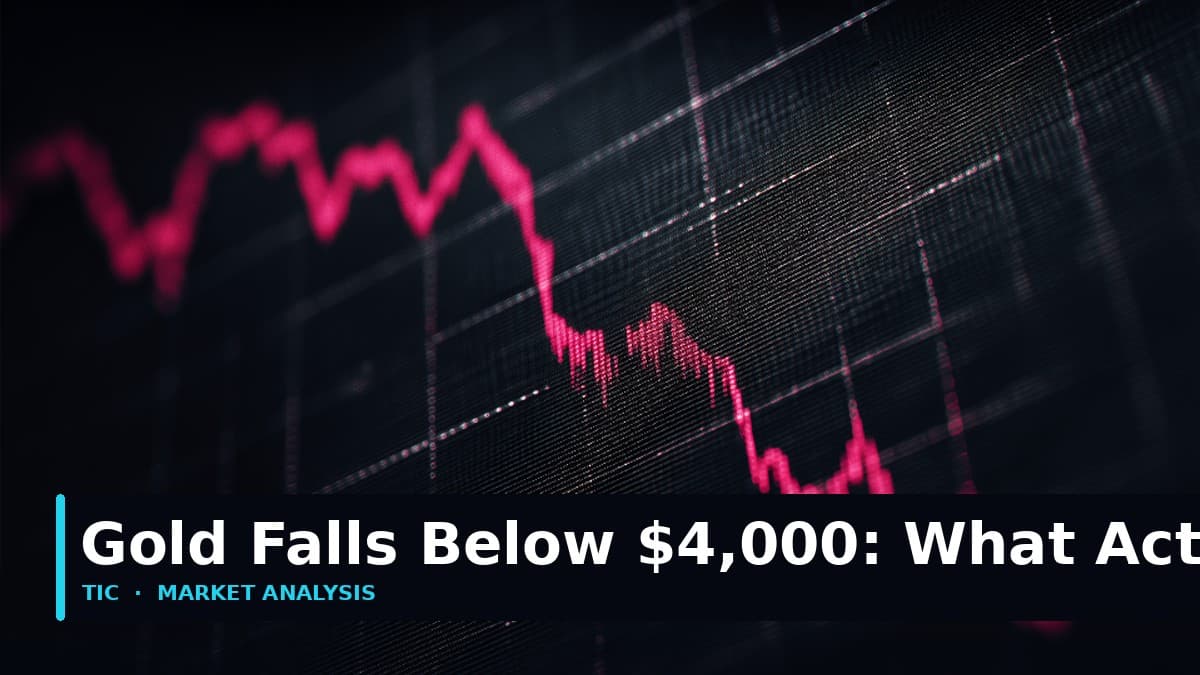
Three separate forces hit gold at the same time in that break week. None of them is the classic "risk-off sends money into gold" story. In fact the opposite happened, and understanding why matters more than the price level itself.
Force one: margin calls, not fear
The same day gold broke $4,000, the Nasdaq fell about 2 percent in one of its worst sessions of the year. Intel lost 29 percent on a weak PC outlook. Alphabet lost roughly $500 billion in market value in a single day as its own AI search product hit its advertising business.
When moves like that hit a portfolio, leveraged traders do not get to choose what they sell. They sell what still has bids and what is up on the year, to meet margin calls on what is down. Gold, still holding large gains for the year even after the break week, was the ATM. This is liquidity-driven selling: gold was not sold because the gold thesis broke. It was sold because it was the most liquid thing left standing in a portfolio that needed cash by the close.
Market analysts compared the break week's pattern to the April 2025 washout, another liquidation episode where the selling had almost nothing to do with gold's own fundamentals. For a live anatomy of a gold liquidation washout, see our March 2026 crash breakdown. Washouts like that end faster than fundamental bear markets. They also overshoot.
Force two: the Fed repriced the cost of holding gold
Two days before the break, the Federal Reserve held rates at 3.75 to 4.00 percent. Two members dissented, and they dissented in the hawkish direction: they wanted a hike. Oil is the reason. Brent crude near $114 on Strait of Hormuz tanker attacks feeds straight into inflation, and the market now prices roughly an 8-in-10 chance of a rate HIKE in December.
Gold pays no interest. When the expected policy path shifts from cuts toward hikes, the opportunity cost of holding a zero-yield asset rises. That repricing started two days before the break and the positioning followed it downhill. Notice the causal chain, because it inverts what most people expect from war headlines: escalation pushed oil up, oil pushed expected rates up, expected rates pushed gold down. The dollar was the first beneficiary of the fear trade, not gold. That is exactly how our research desk frames geopolitical escalation, and the break week was a live demonstration: a war-risk week in the Gulf and gold fell 4 percent.
Force three: the flows and the positioning were already leaning the wrong way
Two quiet structural changes preceded the break.
First, gold ETF inflows, positive for 13 straight weeks, turned negative in the days before the break. Thirteen weeks of inflows unwind slower than one week of margin calls, but the direction flipped.
Second, and more telling: the speculator crowd had already been getting out for seven weeks. As of the CFTC report of October 27, big speculators held 86 percent of their gold book long, a net position of +186,451 contracts, down 13,414 on the week and the seventh consecutive weekly decline in net longs, from +231,960 on September 8. Since the end of September the long side has come down 10.4 percent while the short side grew 19.8 percent. The crowd has been de-risking since long before the break. When positioning is stretched long and the price starts down, liquidation feeds on itself, which is precisely the amplification the drop showed.
Is the safe haven thesis dead?
No. It failed that week for a specific, knowable reason, and that reason is cyclical, not structural.
What gold stopped being, in that week, was a liquidity haven. When everyone needs dollars at the same time, the dollar is the only haven that is always liquid, and gold gets sold to fund it. That has happened repeatedly across this entire bull cycle, most recently in April 2025, and the structural story has survived every single instance.
The structural story is the part that did not move. Central banks kept buying. The recent pace runs roughly 85 tonnes per month on a seasonally adjusted basis, with China and Poland steady, and roughly 800 tonnes accumulated since 2025. Central bank demand is a slow variable. It does not show up in a Friday session. It shows up over quarters, and it is why every sell-off in this cycle has eventually found a floor well above the previous cycle's ceiling.
The desks know this. Goldman Sachs cut its year-end target that week, and even after the cut it still sees gold at $4,650 by year end, about 16 percent above Friday's price. HSBC's 2026 average is $4,490. There is no major desk publishing a 12-month forecast below where gold changed hands Friday. The bear case is a positioning and rates story with a clock on it. The bull case is a debt, de-dollarization and central bank story with no clock on it at all.
The November runway: Doha first, then three events
The week ahead decides whether this washout extends or exhausts, and it opens with a diplomatic binary. As of Tuesday, November 3, Qatari mediators are shuttling proposals between Tehran and Washington in real time: a Qatari team met Iranian officials in Tehran for more than three hours on Monday, both sides are now reviewing the draft, and a senior Iranian official told Reuters the two remain far apart, with responses expected within about 36 hours (Al Arabiya, November 3). The US midterm elections land today, the October jobs report lands November 6, and October CPI lands November 10, ten days before the December Fed conversation becomes real. We mapped this month's full event runway in Gold Price Forecast November 2026; the washout took out the lower edge of that piece's working range, and the three events still decide what happens next.
The Doha track matters for gold in a specific way, and it is the opposite of the headline instinct. A genuine de-escalation deal is bullish for gold, not bearish, because the thing the dollar has been hoarding all month is the war premium. Take the escalation bid out of the dollar and the structural gold story, the debt and central bank demand that never went anywhere, gets the field back. Reuters reporting already flags the mirror risk: the conflict could escalate again once the November 3 vote is past. That is the bearish leg of the framework, escalation equals dollar strength, and the break week was that leg in action.
Scenario one, hawkish extension. A strong jobs report plus the December hike getting fully priced keeps the pressure on, and a Doha collapse after the midterms would restock the dollar's war premium. The first level to watch is $3,886, the low of the break range in our desk's hourly data. Below that, the June 2026 base near $3,700 becomes the reference. The hawkish scenario is the continuation trade, and positioning already seven weeks lighter means there is less left to liquidate at each lower level.
Scenario two, stabilization. The most common outcome after a margin-call washout is a violent range. Gold chopping between $3,886 and $4,040 while the market waits for the data would be textbook, and the midterms add a natural three-day volatility window inside it.
Scenario three, relief. A Doha breakthrough unwinds the dollar's war premium, and weak jobs data would unwind the December hike odds. Either one eases the pressure, and gold reclaims $4,000 then $4,038. The reclaim itself becomes the signal: an asset that cannot hold a 4 percent one-day discount after a liquidation is telling you the forced sellers are done.
A practical framework for trading the aftermath
- Do not treat the break as a verdict. Treat it as a margin call. Forced selling clears in days, not quarters. Decide which time frame you are actually trading before you touch the level.
- Let the November 6 and November 10 data settle the rates question before adding to structural positions. A hike fully priced is bearish; a hike fully priced and then abandoned on weak data has historically been the setup for the strongest recoveries in this cycle.
- Respect the levels. $3,886 is the line between washout and new downtrend. $4,000 is now resistance until proven otherwise. $4,038 is the confirmation for any relief case.
- Size for overshoot. Liquidation-driven moves regularly exceed fair value by 5 to 10 percent before mean-reverting. Overshoots are where discipline gets paid and leverage gets destroyed.
- Watch the central bank reports, not the war headlines. Escalation is dollar-first in the short run, as the break week proved. The structural gold bid comes from monthly reserve accumulation, and nothing about that week changed its pace.
How TIC fits into this
TIC publishes every closed trade idea, wins and losses included, and the live Track Record is public. The TIC app covers this exact workflow: Academy for the structural fundamentals, Paper Trade to test a recovery framework with virtual money before the data lands, and live trade ideas with entry, stop loss and take profit levels on Pro or Elite. Washout weeks are process weeks. The traders who survive them are the ones who sized before the margin call, not after it.
Past performance is not indicative of future results. Trading involves risk of loss. This article is market commentary, not financial advice.
Verify any trader's results in 10 minutes
Seven checks that reveal whether a track record is real: third-party verification, maximum drawdown, trade count, and the martingale warning signs. Use it on anyone, including on us.
We'll send the checklist plus occasional TIC insights. We never share your email, and you can unsubscribe any time.