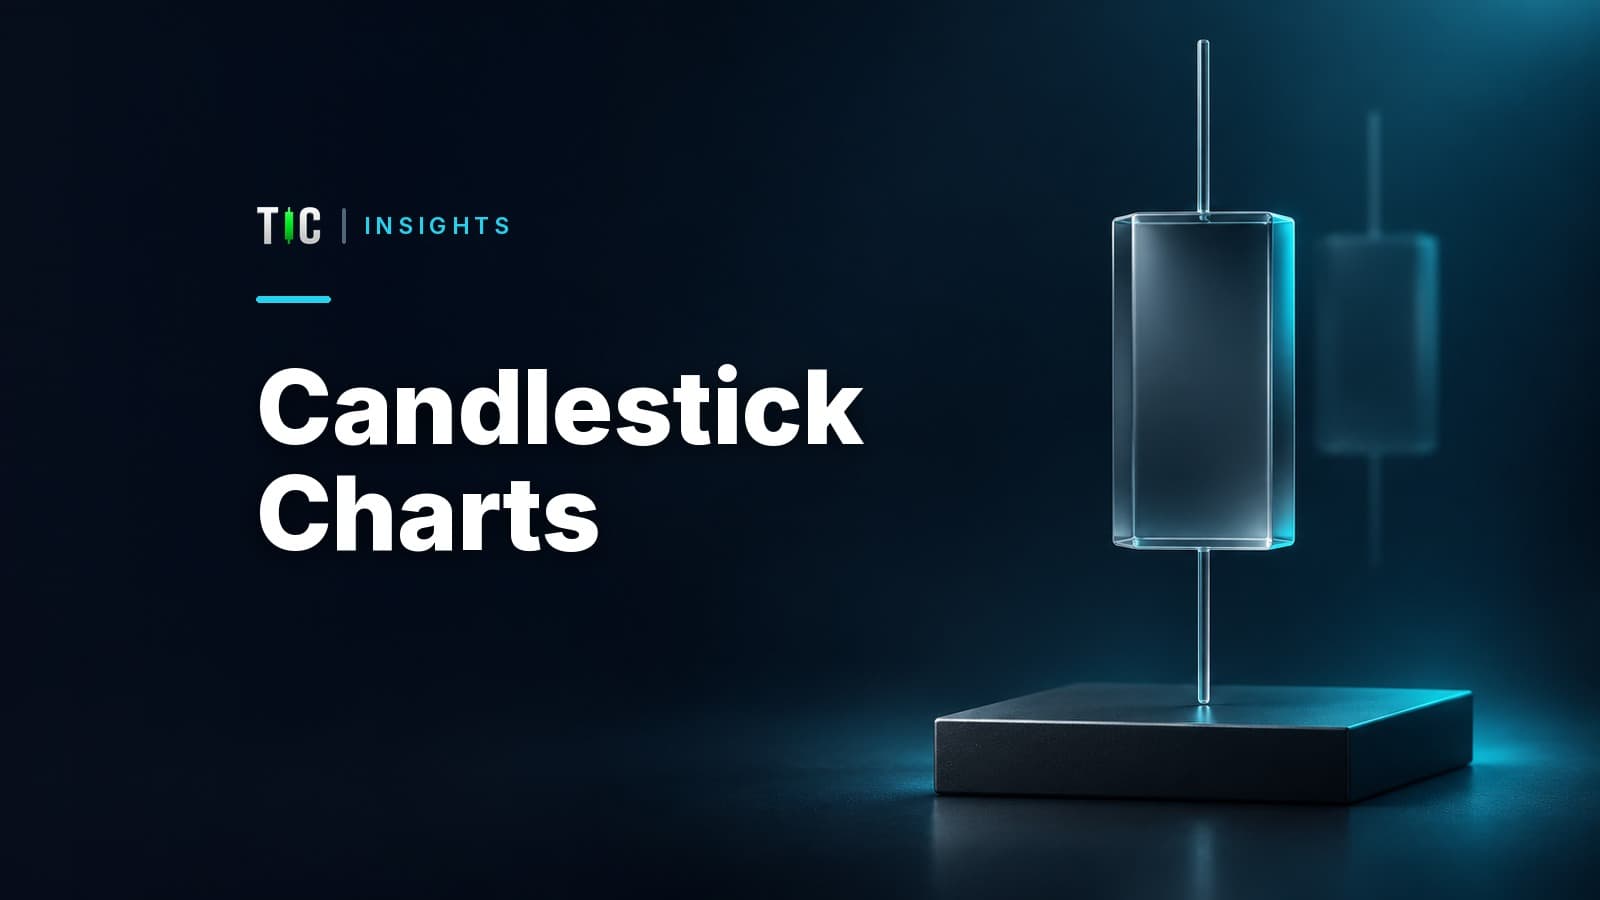
The reader query “what is a candlestick chart?” has a simple definition but an important limitation: a candle is a summary, not a replay of every trade. A five-minute candle and a daily candle can describe the same market at different resolutions.
What does one candlestick show?
Every completed candle contains OHLC data:
| Field | Meaning |
|---|---|
| Open | First recorded price in the period |
| High | Highest recorded price in the period |
| Low | Lowest recorded price in the period |
| Close | Last recorded price in the period |
If close is above open, platforms commonly colour the candle bullish; if close is below open, they colour it bearish. Colours are settings, not universal facts. TradingView's official candlestick introduction confirms the OHLC structure and explains that the body and shadows visualise these four points.
The upper wick measures from the higher edge of the body to the high; the lower wick measures from the lower edge to the low. A long wick shows that price visited an area and moved away before the close, but it does not reveal why.
How do you read a hypothetical gold candle?
Consider a hypothetical one-hour XAUUSD candle:
- Open: $4,100
- High: $4,118
- Low: $4,092
- Close: $4,112
The candle is bullish because $4,112 is above $4,100. Its body is $12, its full range is $26, its upper wick is $6 and its lower wick is $8.
| Measurement | Calculation | Result |
|---|---|---|
| Body | $4,112 − $4,100 | $12 |
| Range | $4,118 − $4,092 | $26 |
| Upper wick | $4,118 − $4,112 | $6 |
| Lower wick | $4,100 − $4,092 | $8 |
This does not mean a standard lot made or lost a universal amount. Contract size and product specifications vary. Nor does it tell you the order in which high and low occurred. The price could have fallen first and then rallied, or rallied first and then fell and recovered; identical OHLC values can hide different intraperiod paths.
What changes when you change the timeframe?
A one-minute candle summarises one minute; a four-hour candle aggregates four hours according to the platform's session and time-zone rules. Higher timeframes remove detail and reveal broader structure. Lower timeframes reveal more sequence but also more noise.
A daily candle can differ slightly across platforms if their trading-day cut-offs differ. That does not automatically mean one feed is false. Compare the symbol, product, time zone and session. Our guide to reading a gold chart explains how timeframe choice changes the question being answered.
Also distinguish a completed candle from one that is still forming. During the current period, the high and low may extend and the displayed close can move with each update. A pattern that looks clear halfway through an hour can disappear by the hour's end. Record the data source and whether it shows bid, ask or another price basis when comparing two charts.
Do candlestick patterns predict the next move?
No pattern guarantees direction. A hammer, engulfing candle or doji is a description of recent OHLC geometry. Its usefulness depends on context, data quality, trend, volatility, liquidity and a tested rule for entry, exit and invalidation.
It also does not show the spread paid, the slippage at an order or whether a wick was formed during a thin quote. Pair the chart with an understanding of spread, slippage and volatility.
A responsible test defines the pattern mechanically, includes costs, avoids looking into future candles and evaluates enough out-of-sample trades. Looking at a chart after the move and naming the perfect pattern is hindsight, not a strategy.
How should beginners use candlesticks?
Start with description rather than prediction:
- Name the timeframe and instrument.
- Read open, high, low and close.
- Measure body and full range.
- Note where the close sits within the range.
- Compare with preceding candles and a relevant level.
- Define what would invalidate the observation.
For the hypothetical candle, a direct description is: “Gold opened at $4,100, traded across a $26 range and closed $12 above the open, near but not at the high.” That is more precise than “buyers are in control forever.”
Source
- TradingView, Introduction to candlestick charts and patterns
Trading carries high risk and you may lose your capital. Past performance does not guarantee future results. Educational only, not investment advice.
Verify any trader's results in 10 minutes
Seven checks that reveal whether a track record is real: third-party verification, maximum drawdown, trade count, and the martingale warning signs. Use it on anyone, including on us.
We'll send the checklist plus occasional TIC insights. We never share your email, and you can unsubscribe any time.