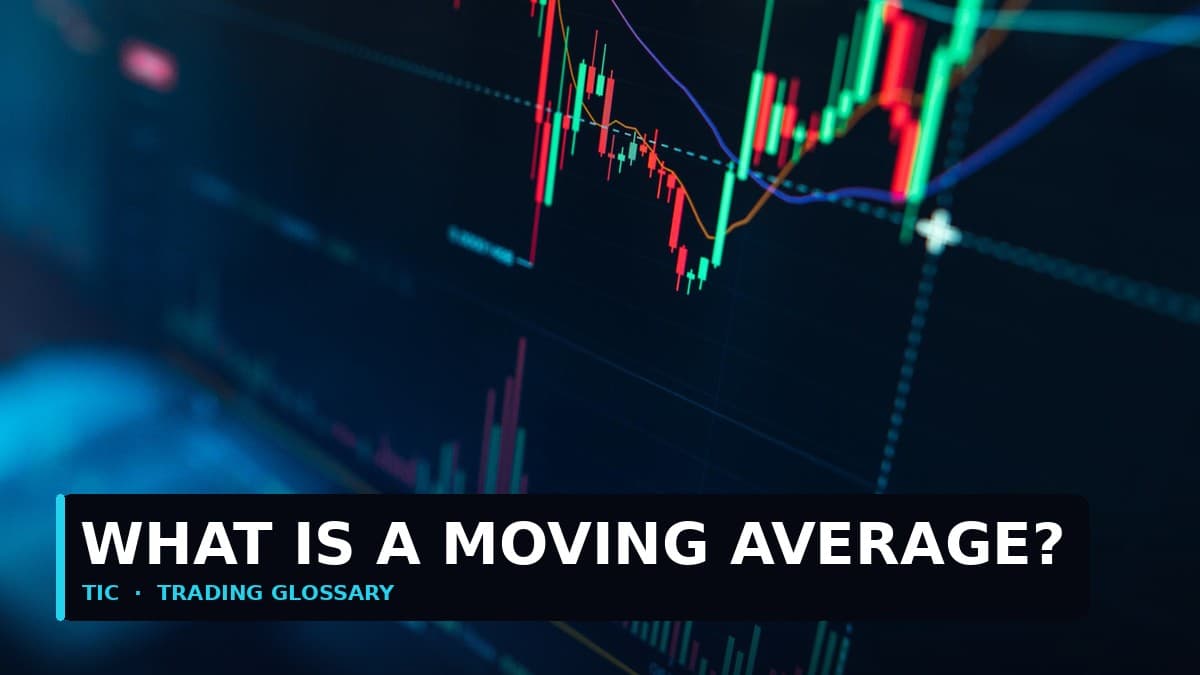
It exists to remove noise: instead of reading every jagged candle, you read one smooth line that shows which way price has been travelling.
That smoothing has a price, and the price is delay. Every moving average is built only from candles that have already closed, so it always reports where the market has been, never where it is going. Understanding that trade-off between smoothness and lag is the whole skill of using one.
How Is a Moving Average Calculated?
The simple moving average (SMA) adds up the last N closing prices and divides by N. When the next candle closes, the oldest price drops out, the newest one comes in, and the average is recalculated. That rolling window is what makes it "moving".
Here is a 5-period SMA on five illustrative daily gold closes:
- Closes: 3,500, 3,512, 3,506, 3,520, 3,532
- Sum: 17,570
- SMA: 17,570 divided by 5 = 3,514
Now the next day closes sharply higher at 3,580. The oldest close, 3,500, leaves the window and 3,580 joins it:
- New sum: 17,570 minus 3,500 plus 3,580 = 17,650
- New SMA: 17,650 divided by 5 = 3,530
Price jumped 48 dollars in one day, but the SMA moved only 16. That gap is the lag, shown in a single step.
What Is the Difference Between SMA and EMA?
The exponential moving average (EMA) gives more weight to the most recent candles, so it reacts faster than an SMA of the same length. The SMA treats every candle in the window equally; the EMA leans towards the newest ones.
The EMA uses a weighting factor of 2 divided by (N + 1). For a 5-period EMA that is 2 divided by 6, or 0.333. Each new EMA equals the previous EMA plus 0.333 times the difference between the new close and the previous EMA. Starting from the same 3,514 and the same 3,580 close:
- Difference: 3,580 minus 3,514 = 66
- Weighted step: 66 times 0.333 = 22
- New EMA: 3,514 plus 22 = 3,536
So on the same day the EMA rose to 3,536 while the SMA reached 3,530. The EMA caught more of the move. The flip side is that it also chases more false moves, because a single sharp candle pulls it harder.
| Feature | Simple moving average (SMA) | Exponential moving average (EMA) |
|---|---|---|
| Weighting | Every candle in the window counts equally | Recent candles count more |
| Reaction to a sharp move | Slower | Faster |
| False signals in choppy markets | Fewer | More |
| Typical use | Long-term trend filters (50, 100, 200) | Shorter-term momentum (9, 20, 21) |
Neither is better. They answer slightly different questions, and choosing one because it "looks right" on a chart you have already seen is hindsight, not analysis.
How Much Does a Moving Average Lag?
A simple moving average lags price by roughly (N minus 1) divided by 2 candles. A 20-period SMA is centred about 9.5 candles in the past; a 200-day SMA is effectively describing where price was about 100 trading days ago.
That number is worth holding in your head. When someone says gold "just crossed above its 200-day average", what has actually happened is that today's price rose above a line summarising the last ten months. It is a meaningful description of the long-term trend. It is not fresh information, and the market has usually moved a long way before the line confirms it.
Do Moving Average Crossovers Work?
Sometimes, and far less reliably than their popularity suggests. A crossover is when a faster average crosses a slower one, for example the 50-day moving above the 200-day (often called a "golden cross") or below it (a "death cross"). Because both lines lag, the signal arrives after a large part of the move is already over.
In a strong, persistent trend, a crossover can keep you on the right side of the market for a long time, and that is its genuine strength. In a sideways market it is costly: the lines cross back and forth, each cross triggers a new trade, and each trade pays the spread and usually a small loss. This is called whipsaw, and in ranging conditions it can erase the gains from the trends that did work.
The honest summary is that a crossover system is a trend-following system, and trend following only earns in trending markets. Whether it made money on your chart last year says little about next year, for exactly the reasons covered in backtest versus live results.
Which Moving Average Period Should You Use?
Use the periods that the market you trade actually respects, and then leave them alone. The widely watched ones are the 20, 50, 100 and 200, and part of the reason they matter is that so many participants watch them.
| Period | What it usually represents | Common use |
|---|---|---|
| 9 to 21 | Short-term momentum | Timing within an existing trend |
| 50 | Medium-term trend | Pullback reference in a trend |
| 100 | Intermediate trend | Secondary support or resistance |
| 200 | Long-term trend | "Is the market broadly rising or falling?" |
Two practical rules help. First, a moving average works better as a filter than as a trigger: "only look for buys while price is above the 200-day" is a sounder use than "buy every time price touches the 20". Second, pair it with structure. A moving average sitting exactly where a previous swing high or low also sits carries far more weight than one floating in empty space, which is why reading structure on a gold chart comes first. Momentum tools such as RSI can add context, but they lag too.
Where Does a Moving Average Fit in Risk Management?
It can help you decide where a trade idea is wrong, but it must never decide how much you risk. Some traders place a stop beyond a key average, on the logic that a close through it invalidates the trend. That is a reasonable way to choose a level. The amount you lose if that level is hit is set by your position size, and that arithmetic lives in how a stop loss works, not in any indicator.
Moving averages are useful precisely because they are simple and honest about what they are: a smoothed record of the past. The trouble starts when a line built from yesterday's prices is treated as a forecast of tomorrow's.
That is the same standard TIC applies to its own trading: judge it on independently verified outcomes over time, not on how a chart looked at the moment of entry. The full Myfxbook record, losing months included, is published at /results.
trading carries high risk and you may lose your capital; past performance does not guarantee future results; educational only, not investment advice.
Verify any trader's results in 10 minutes
Seven checks that reveal whether a track record is real: third-party verification, maximum drawdown, trade count, and the martingale warning signs. Use it on anyone — including on us.
We'll send the checklist plus occasional TIC insights. We never share your email, and you can unsubscribe any time.