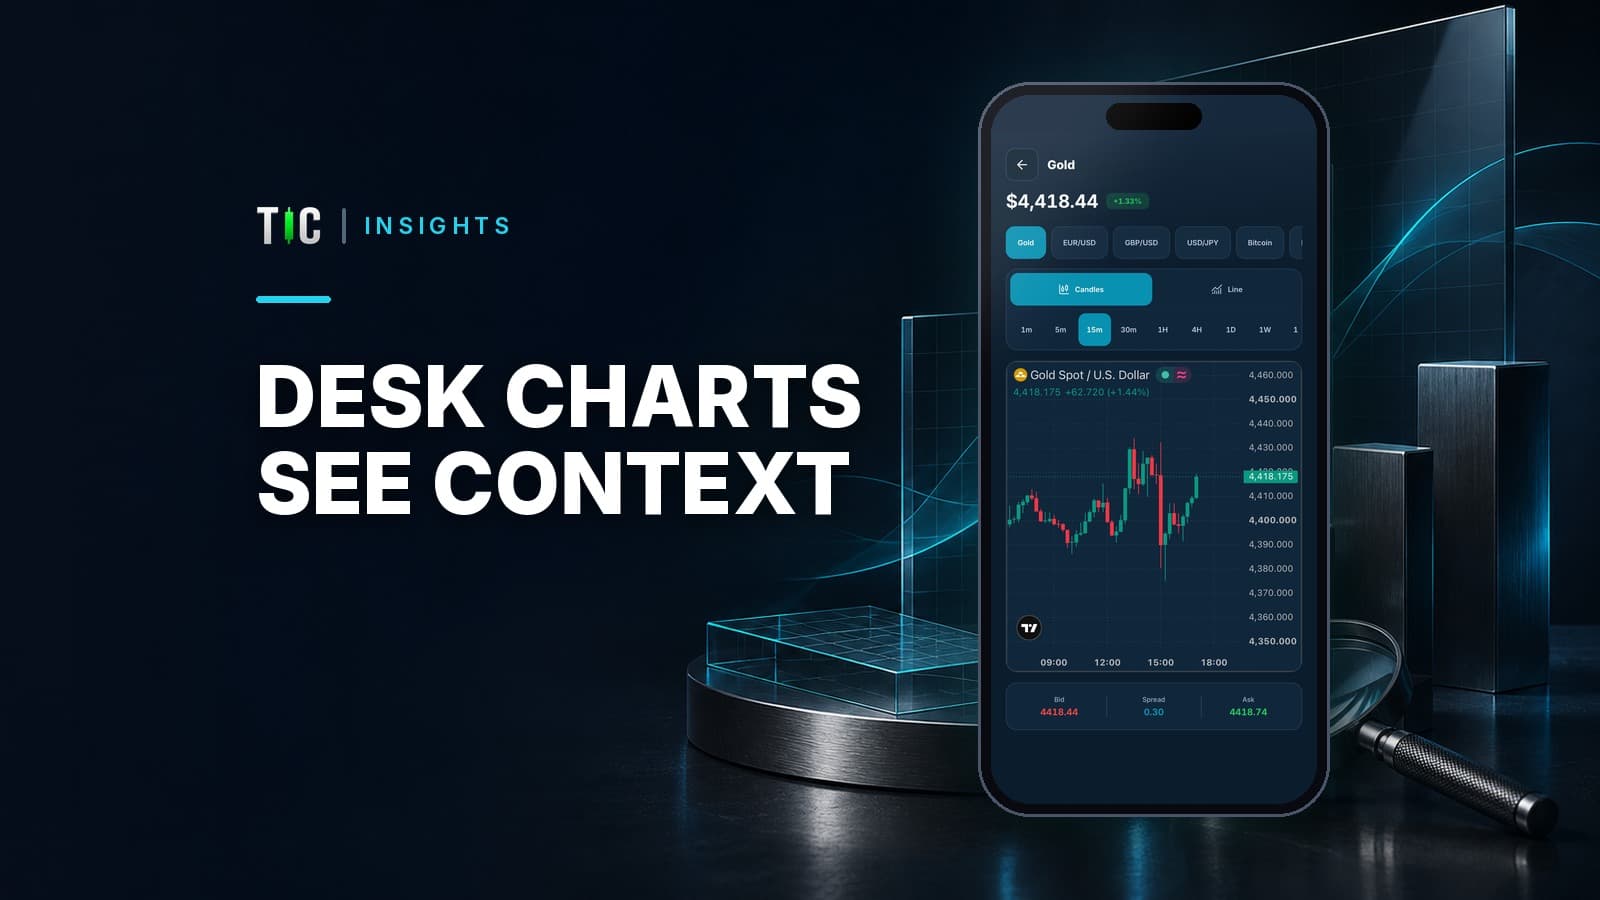
The feature does not predict the next candle or remove risk. It gives you a clearer surface for a repeatable chart-reading routine, using the same TIC account across web and mobile.
The current product page identifies TIC Desk as the browser version of TIC and shows market charts as a real product surface. You can open it at https://ticai.io/desk. Features depend on the user’s plan; this spotlight focuses on chart analysis rather than trade recommendations.
What do charts on TIC Desk help you see?
On a larger display, you can inspect a wider run of candles, compare timeframes and keep labels readable without constant zooming. That reduces interface friction, although it does not improve the underlying quality of a weak trading idea.
A practical top-down routine begins with the higher timeframe for trend and major levels, moves to an intermediate timeframe for structure, then uses a lower timeframe only for execution detail. If the daily chart is making lower highs while a five-minute chart looks strong, the short-term move should not erase the higher-timeframe context. The gold chart-reading guide explains candles, timeframes and levels.
| Step | Question | Useful chart view | Common mistake |
|---|---|---|---|
| Context | Is price trending or ranging? | Daily or 4-hour | Starting at one-minute |
| Structure | Where are repeated reactions? | 1-hour | Drawing too many levels |
| Trigger | What confirms the setup? | 15- or 5-minute | Entering before confirmation |
| Risk | Where is the idea invalid? | Structure plus price scale | Choosing size before stop |
How can you build a repeatable analysis routine?
First mark only obvious swing highs, lows and zones with repeated reactions. Second classify the environment as trend, range or transition. Third note the next scheduled event. Fourth define invalidation. Fifth calculate size independently from conviction.
Worked example: gold trades around 2,640. A daily zone sits near 2,620–2,625, while the one-hour chart shows resistance near 2,655. Instead of predicting, define scenarios. Above 2,655 with acceptance, the range may be expanding; below 2,620, the support thesis is invalid. Between them, the market remains inside a 35-dollar area. If the planned stop distance is $8 and cash risk is $80, the position size must reflect the broker’s contract multiplier, not the visual attractiveness of the setup.
This scenario method resembles the discipline behind risk/reward planning: define what must happen, what disproves the idea and how much can be lost. A chart is evidence organised visually, not an instruction to trade.
What syncs between TIC Desk and the phone app?
The platform documentation describes mobile and browser access under the same account. Exact availability varies by plan and feature, so the interface is the source of truth for your account.
The value is continuity: review on a larger screen, then return to the phone without treating the web session as a separate identity. Privacy still depends on account security. Use a unique password, enable available login protections, sign out on shared machines and avoid saving credentials in public browsers. The two-factor authentication guide covers the added login layer.
What can the chart tool not do for you?
A clean line on a chart does not guarantee execution at that line. Prices can differ slightly among data sources, and fast markets can create slippage. Confirm executable prices and contract terms with the broker before calculating a trade.
It also cannot prove that a pattern has an edge. Seeing the same formation twice is not a backtest. Record rules, test enough observations and separate in-sample discovery from out-of-sample review. Larger screens can encourage over-analysis, so limit indicators to those with distinct jobs. Two momentum tools measuring similar information do not create independent confirmation.
Who is TIC Desk charts for?
It is useful for structured preparation, study and post-trade review. It is not a substitute for your broker’s execution service, an execution platform’s contract specification or personal risk limits.
Open TIC Desk and begin with one market and three timeframes. Write one sentence for context, one for invalidation and one for risk. If those sentences are unclear, adding more indicators will not fix the plan. The honest advantage of a bigger screen is clarity, not certainty.
Trading carries high risk and you may lose your capital. Past performance does not guarantee future results. Educational only, not investment advice.
Available on iOS and Android
iOS — App Store
iPhone and iPad — free download
Android — Google Play
All Android devices — free download
Download TIC Free Today
Full academy, paper trading, and four calculators — no credit card required. Upgrade to Pro or Elite when you're ready.
The TIC App subscription is separate from the copy-trading 30% performance fee — they are two independent services.
Verify any trader's results in 10 minutes
Seven checks that reveal whether a track record is real: third-party verification, maximum drawdown, trade count, and the martingale warning signs. Use it on anyone, including on us.
We'll send the checklist plus occasional TIC insights. We never share your email, and you can unsubscribe any time.