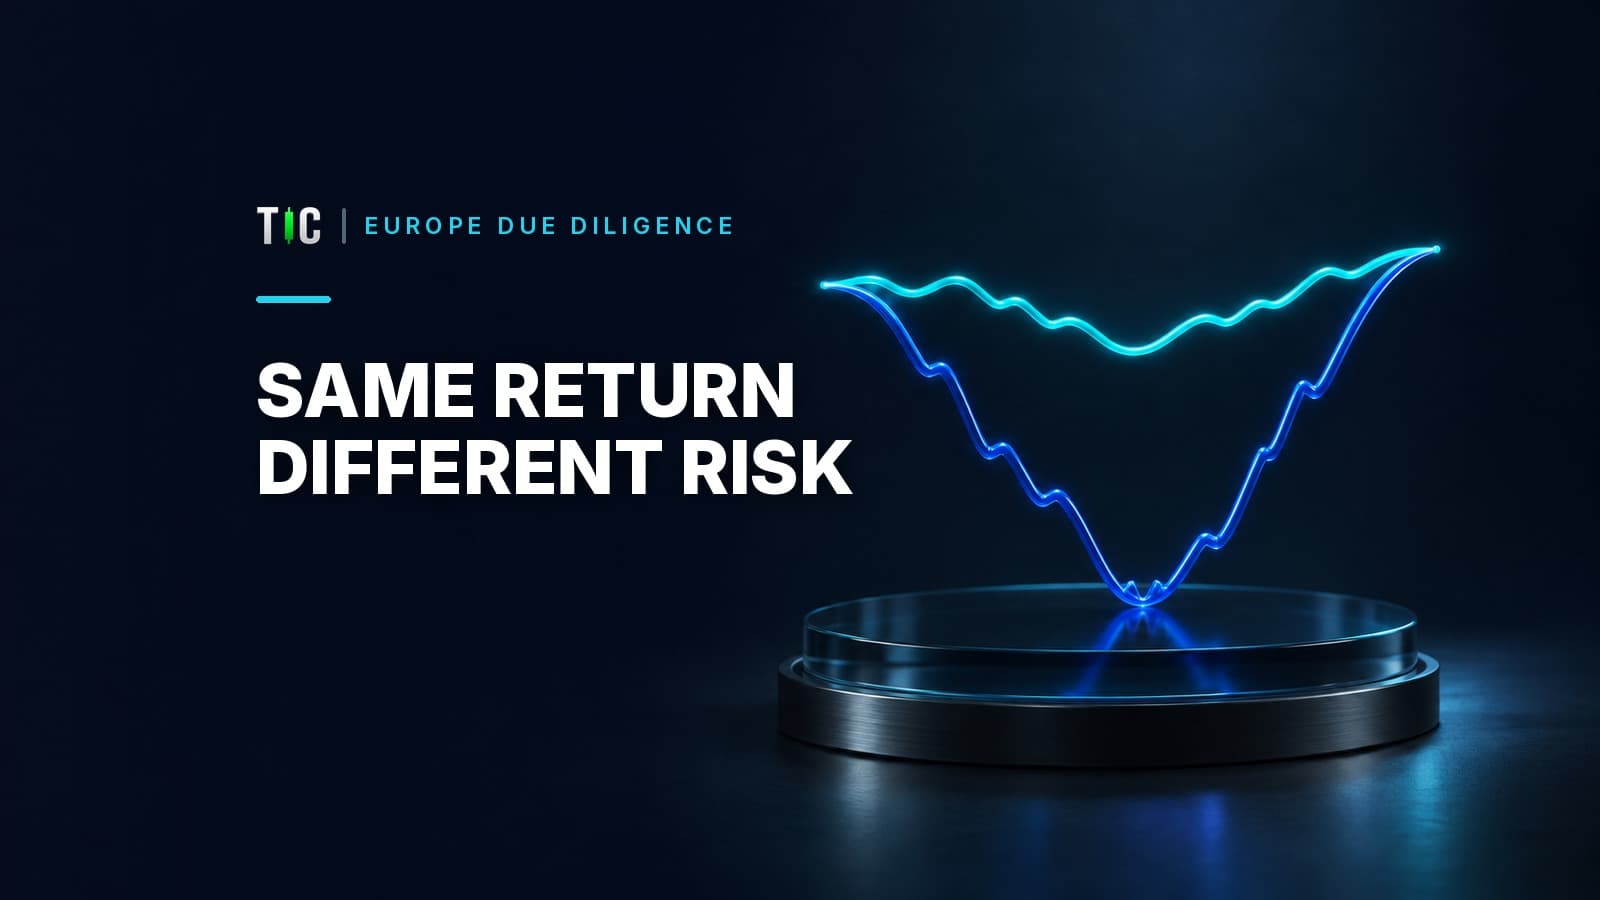
For a funded trading account with no cash flows, multiplication makes the final result independent of order. Once deposits, withdrawals, fees, leverage changes or investor behaviour enter the record, the path can change both the money outcome and the chance of abandoning the strategy.
What is sequence of returns risk in a trading record?
It is the risk created by when good and bad periods occur. A simple average hides that path. Consider four annual returns: +20%, +10%, -10% and -20%. Starting with EUR 10,000 and making no withdrawals, every ordering ends near EUR 9,504 because the same four multipliers are applied. The arithmetic mean is zero, yet the compounded result is a loss of 4.96%; this is volatility drag.
Now add a EUR 1,000 withdrawal at each year-end. If the -20% and -10% years occur first, the balance after four withdrawals is about EUR 5,720. If the +20% and +10% years occur first, it is about EUR 5,992. The return set is identical; the cash-flow timing creates a EUR 272 difference. This is why a provider's headline average is not enough.
| Record | Same returns? | Cash flows? | Path matters to final cash? |
|---|---|---|---|
| Closed account, no deposits/withdrawals | Yes | No | Not for final product, but yes for drawdown |
| Investor withdrawing regularly | Yes | Yes | Yes |
| Strategy changing leverage after losses | Yes | Effectively | Yes |
| Investor likely to stop after a deep loss | Yes | Behavioural | Yes |
Why is the average return an incomplete due-diligence number?
The arithmetic mean does not compound. A gain of 50% followed by a loss of 50% averages zero but turns EUR 10,000 into EUR 7,500. The geometric return captures compounding: (1.5 × 0.5)^(1/2) - 1, or about -13.4% per period.
A provider can advertise an average that is mathematically true and economically misleading. Ask for period-by-period returns, equity rather than balance, deposits and withdrawals, fees, and the exact method used. Our guide to time-weighted and money-weighted returns explains which calculation isolates strategy performance and which reflects the investor's cash experience.
A smooth final gain can contain a drawdown that many clients could not tolerate. Conversely, one early loss does not prove a strategy is invalid. Due diligence asks whether the risk process, exposure and disclosure remained consistent.
How do drawdown and recovery expose the sequence?
Maximum drawdown measures the largest peak-to-trough decline in the observed equity curve. A 20% loss needs a 25% gain to recover; a 40% loss needs 66.7%; a 50% loss needs 100%. That nonlinear recovery burden is why an early deep loss can be so destructive when withdrawals continue.
Assume EUR 100,000 falls 30% to EUR 70,000. Recovering to the original level requires EUR 30,000, which is 42.86% of the reduced balance. If EUR 5,000 is withdrawn before recovery, the base becomes EUR 65,000 and the required gain rises to 53.85%. Sequence risk is therefore not an abstract retirement concept; it matters whenever money leaves a volatile strategy.
Read drawdown and Sharpe together, because a ratio based on monthly returns can still hide one severe intra-month drop. A verified equity curve is stronger evidence than a table of monthly balances.
What should a European reader verify before trusting the record?
First, verify identity and authorisation in the relevant national regulator's register; do not accept a logo or a licence number copied into a PDF. ESMA's Investor Corner directs consumers to warnings and national authorities, while the FCA's Firm Checker explains how UK consumers can check permissions and clone-firm warnings. Authorisation does not prove skill or prevent ordinary trading losses.
Second, verify the record independently. Check whether the data connects to the broker, whether open trades are visible, whether deposits are separated from profit, and whether losing periods remain in the history. TIC's independently verified Myfxbook record appears once as an educational example on the results page; the point is the standard of evidence, not a solicitation.
Third, request the fee schedule and compare gross with net results. A 12% gross year with a 2% fixed charge and 20% performance fee is not a 12% investor return. The exact fee mechanics and high-water mark matter.
Does investor compensation protect against a bad sequence?
No. Compensation schemes address specified failures of authorised firms, not ordinary market losses, poor strategy performance or a lawful product falling in value. Bank deposit guarantees are also not the same as investment protection.
For EU context, the European Commission describes investor-compensation schemes as protection when an investment firm cannot return assets; it is not insurance against investment risk. For the UK, the FSCS investment-protection page sets out eligibility and exclusions. Check current status and limits on the official pages at the time of a decision rather than relying on an old article.
Which comparison makes sequence risk visible?
Ask for rolling 12-month returns, monthly equity data, worst month, maximum drawdown, recovery time and exposure through the drawdown. Then run a simple stress test: move the two worst periods to the beginning, add realistic withdrawals or fees, and ask whether the account and the investor would survive.
| Question | Weak answer | Useful evidence |
|---|---|---|
| What was the worst path? | “The average was 12%” | Monthly equity and maximum drawdown |
| Were cash flows separated? | Screenshot | Deposit/withdrawal ledger |
| Did risk change after loss? | “We adapted” | Position-size and exposure history |
| Is performance complete? | Selected months | Independently linked full history |
This test does not forecast the future. It exposes whether the claimed result depends on favourable timing, hidden cash flows or unstable risk. Our track-record sample-size guide adds the other key limitation: even a clean sequence can be too short to establish an edge.
What is the honest conclusion?
No metric rescues a weak record. Sharpe, drawdown and averages are summaries, not substitutes for complete data. The best defence is a full independently verified equity history, consistent sizing, transparent fees, enough observations and a legal-status check made directly with the regulator.
Most importantly, evaluate whether you could live through the bad sequence without changing size, withdrawing at the worst point or abandoning the process. A return you cannot behaviourally or financially survive is not a suitable return, however attractive its average looks.
Sources
- ESMA, Investor Corner
- FCA, Firm Checker
- European Commission, Investor-compensation schemes
- FSCS, Investment protection
Trading carries high risk and you may lose your capital. Past performance does not guarantee future results. Educational only, not investment advice.
Verify any trader's results in 10 minutes
Seven checks that reveal whether a track record is real: third-party verification, maximum drawdown, trade count, and the martingale warning signs. Use it on anyone, including on us.
We'll send the checklist plus occasional TIC insights. We never share your email, and you can unsubscribe any time.